
Epsom and Ewell's average home reached £566,163 in August, up £17,810 in a year and top of Surrey's 11 districts. But prices slipped for a second month.
House prices in Epsom and Ewell rose faster than anywhere else in Surrey in the year to August. The average home sold for £566,163, up £17,810 on a year earlier. That is a rise of 3.2%.
Surrey as a whole fell 0.2% over the same twelve months. Five of its eleven districts lost value.
The figures come from the UK House Price Index. HM Land Registry published the August release on 21 October. It is built from completed sales, not asking prices.
The headline needs one caution before anyone reads it as a boom. Prices in the borough actually fell in both July and August. The annual figure looks strong partly because August 2025 was a low month to compare against.
These figures cover Epsom and Ewell borough only: Epsom, Ewell, Stoneleigh, Worcester Park, West Ewell, Langley Vale and the Downs. Ashtead and Leatherhead are in Mole Valley. Banstead and Tadworth are in Reigate and Banstead.
Top of the county
| Area | Average price | Change over 12 months |
|---|---|---|
| Epsom and Ewell | £566,163 | +3.2% |
| Surrey Heath | £457,981 | +1.5% |
| Mole Valley | £552,344 | +1.4% |
| Elmbridge | £735,548 | +0.7% |
| Guildford | £537,660 | +0.6% |
| Reigate and Banstead | £485,856 | +0.3% |
| Tandridge | £506,774 | −1.1% |
| Runnymede | £472,507 | −1.2% |
| Spelthorne | £440,812 | −1.6% |
| Waverley | £559,306 | −2.0% |
| Woking | £437,628 | −2.7% |
| Surrey | £524,334 | −0.2% |
| South East | £379,953 | −0.8% |
| England | £293,525 | +0.4% |
Epsom and Ewell’s rise is more than double the next district’s. Surrey Heath managed 1.5% and Mole Valley 1.4%. In July the borough was third in the county; in August it went to first.
On price it is still second of the eleven, behind Elmbridge. The borough average is £41,829 above Surrey’s and close to double England’s.
The neighbours across the London boundary are worth a look. Kingston upon Thames rose 4.9% to £597,587, faster still. Sutton rose 1.5% to £458,954, which is £107,209 below Epsom and Ewell.
Why the year looks better than the last two months
The borough’s average price by month tells a different story from the annual figure:
- August 2025: £548,353
- September: £540,366
- October: £541,911
- November: £545,857
- December: £542,630
- January 2026: £540,493
- February: £544,956
- March: £552,548
- April: £560,817
- May: £567,577
- June: £568,770
- July: £566,882
- August 2026: £566,163
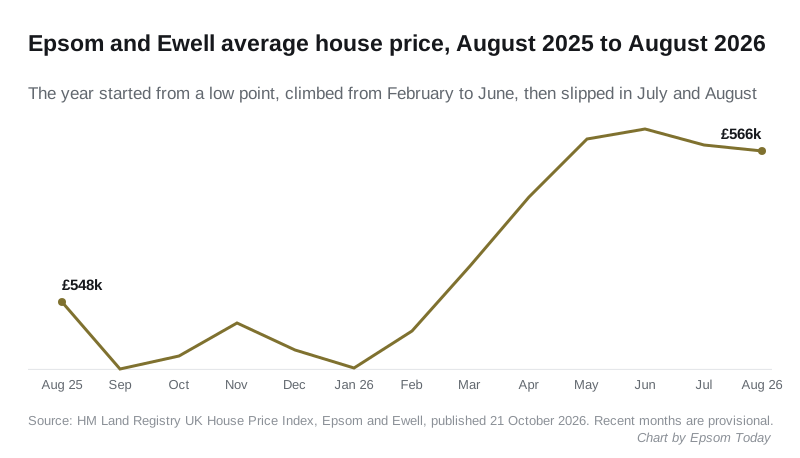
Two things stand out. August 2025 was itself a fall of 1.6% in a single month, so the year-on-year comparison starts from a dip. And the borough has now fallen two months running: 0.3% in July and 0.1% in August. The peak was June, at £568,770.
Neither fall is large. The Land Registry also revises recent months as late sales are registered. But the honest summary is a market that rose strongly in the spring and has levelled off since.
Over two years the picture is flatter. In August 2024 the borough average was £548,899. Today’s figure is £17,264 higher, a rise of 3.1% across two years rather than one.
Semis and terraces did the work
| Type | August 2026 | August 2025 | Change |
|---|---|---|---|
| Detached | £975,736 | £945,273 | +3.2% |
| Semi-detached | £647,950 | £618,388 | +4.8% |
| Terraced | £490,611 | £469,317 | +4.5% |
| Flat or maisonette | £299,227 | £296,699 | +0.9% |
The semi-detached house rose fastest, gaining £29,562 in a year. The terrace was close behind. The flat barely moved, up £2,528.
That fits the longer pattern. On the Land Registry’s index, where January 2023 is set at 100, the types now read:
- semi-detached: 103.2
- terraced: 103.3
- detached: 100.0
- flat or maisonette: 95.9
A flat in the borough is still worth about 4% less than at the start of 2023. A semi or a terrace is worth about 3% more.
How many homes are selling
The index counts sales too, though it runs two months behind and revises them for a year. The latest month with a count is June 2026, with 62 sales across the borough.
- January to June 2026: 386 sales
- January to June 2025: 550 sales
- January to June 2024: 411 sales
The 2025 total is swollen by March 2025, when the borough registered 222 sales as buyers raced to complete before stamp duty thresholds changed on 1 April 2025. Leave March out and the other five months give 306 sales in 2026, 328 in 2025 and 344 in 2024. So the market is a little quieter than in the last two years, not dramatically so.
What it means for you
If you are selling a semi or a terrace, the past year has gone your way, and faster here than anywhere else in Surrey. The two monthly dips since June are a reason to price on today’s evidence rather than on the annual headline.
If you own a flat, your type rose 0.9% over the year and is still below its January 2023 value. The gap between the first-time buyer average of £421,646 and the former owner-occupier average of £700,881 is £279,235. That is the step up the ladder.
If you are buying, the borough is moving against the county. Competition for semis and terraces is where prices are rising. If you are weighing up Ashtead, Leatherhead or Banstead, check the right district: Mole Valley averaged £552,344 in August and Reigate and Banstead £485,856.
The full breakdown is on our Epsom house prices page, updated to the August figures today. Council tax bands do not move with these prices; they still rest on 1991 values, and the table is on our Epsom council tax bands page. What is proposed near any address is on Epsom planning news.
A note on the figures
The UK House Price Index average is a geometric mean, not a median, and it covers every sale in the borough. It describes the market, not the value of any one house.
The index also revises the previous twelve months at every release. When we reported the July figures last month, July read £568,214. It now reads £566,882, £1,332 lower. June has moved from £570,573 to £568,770. We would rather show the revision than overwrite it silently.
Sources: UK House Price Index, Epsom and Ewell (HM Land Registry, Open Government Licence). District, county, regional and England figures from the same dataset for August 2026. UK House Price Index for August 2026, published 21 October 2026.
Revision note, 18 November 2026: HM Land Registry’s September release revised the figures in this report. August 2026 now reads £561,261, up 2.4% on a year earlier, rather than £566,163 and 3.2%. July now reads £562,377 and June £562,795, so the June peak described above has been revised away and the market has been flat since May. The latest figures are in our report on the September figures.
Have your say