
1,130 people in Epsom and Ewell claimed out-of-work benefits in October, up 40 in a month. Under-25 claims fell 12% as every other Surrey district rose.
The number of people claiming out-of-work benefits in Epsom and Ewell rose by 40 in October, to 1,130. That is 2.2 per cent of residents aged 16 to 64.
The figures come from the ONS claimant count, published through Nomis on Tuesday 17 November. September’s count has been revised from 1,095 to 1,090, so the monthly rise is from that revised figure.
Most of October’s increase came from people aged 50 and over. Claims by young people fell again.
Under-25 claims fell here and rose everywhere else in Surrey
There were 180 people aged 16 to 24 on the claimant count in the borough in October 2026. A year earlier there were 205. That is a fall of 25, or 12.2 per cent.
Across Surrey the same age group rose from 2,965 to 3,385, up 14.2 per cent. Every other district rose, from 6.1 per cent in Mole Valley to 25.4 per cent in Elmbridge.
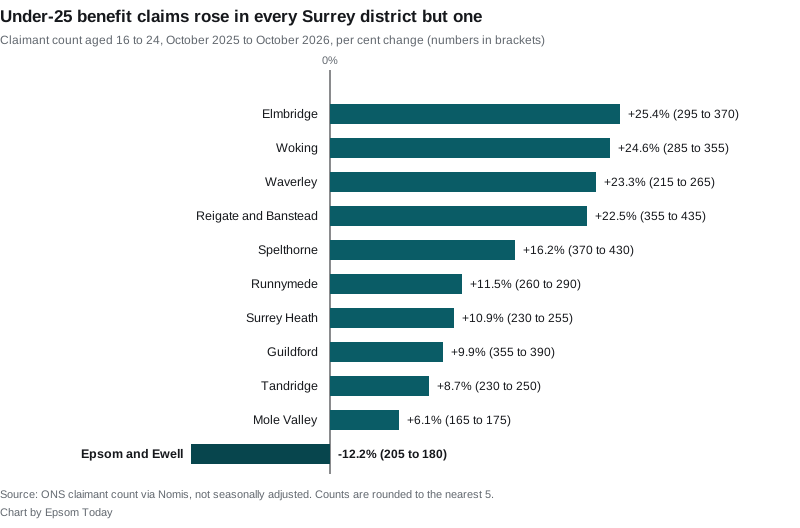
Counts are rounded to the nearest five, so a change of five means little. A fall of 25 is beyond that. In July and September the borough was also the only Surrey district where under-25 claims did not rise.
The whole borough: a smaller rise than most of Surrey
| October 2025 | October 2026 | Change | |
|---|---|---|---|
| Epsom and Ewell | 1,100 | 1,130 | +2.7% |
| Surrey | 17,450 | 18,575 | +6.4% |
Only two Surrey districts had a smaller rise over the year:
- Tandridge, up 0.4 per cent
- Mole Valley, up 1.0 per cent
Runnymede rose most, by 11.7 per cent. Elmbridge and Reigate and Banstead both rose by 10.1 per cent.
Epsom and Ewell’s rate of 2.2 per cent is level with Reigate and Banstead. Three districts are lower: Mole Valley and Waverley at 1.9 per cent and Guildford at 2.0. Spelthorne is highest at 3.6 per cent.
Where October’s rise came from
| Age | Oct 2025 | Sept 2026 (revised) | Oct 2026 | Year change | Surrey year change |
|---|---|---|---|---|---|
| 16 to 24 | 205 | 185 | 180 | -12.2% | +14.2% |
| 25 to 49 | 640 | 640 | 660 | +3.1% | +2.0% |
| 50 and over | 255 | 265 | 290 | +13.7% | +11.1% |
| All ages | 1,100 | 1,090 | 1,130 | +2.7% | +6.4% |
The over-50s rose by 25 in a single month, from 265 to 290. That age group peaked at 305 in June this year and fell back over the summer. It is now rising faster than across Surrey.
Which wards have the most claimants
The October figures by ward show the claims are concentrated in central Epsom.
| Ward | Claimants | Share of 16 to 64s |
|---|---|---|
| Court | 180 | 3.7% |
| Ruxley | 110 | 3.3% |
| Horton | 100 | 3.0% |
| Town | 160 | 2.8% |
| Cuddington | 105 | 2.5% |
Nonsuch has the lowest rate, at 1.1 per cent, followed by Stoneleigh at 1.3 per cent and College at 1.4 per cent. Ward boundaries were redrawn in 2024, so there is no like-for-like ward figure for a year ago.
How to read these figures
- The claimant count records people claiming benefits principally for being out of work. Under Universal Credit that includes some people in low-paid work who must still look for more. It is not the unemployment rate.
- It is not seasonally adjusted, so we compare October with October.
- Every figure is rounded to the nearest five, and the newest month is usually revised slightly a month later.
- The ONS labels the local figures official statistics in development.
- The figures cover Epsom and Ewell borough only. Ashtead and Leatherhead are in Mole Valley.
What it means for you
- If you are 16 to 24 and looking for work here, the local count is lower than a year ago, while it has risen across the rest of Surrey.
- If you are over 50, this is the group where claims rose fastest in October.
- If you live in Court, Ruxley, Horton or Town ward, claim rates there are higher than the borough’s 2.2 per cent.
Sources
- ONS claimant count, dataset NM_162_1, via Nomis, for every figure in this article: Epsom and Ewell (E07000208), its 14 wards, Surrey (E10000030) and Surrey’s eleven districts, by age, October 2025, September 2026 (revised) and October 2026, not seasonally adjusted.
Have your say