
185 people aged 16 to 24 claimed out-of-work benefits in Epsom and Ewell in September, against 190 a year ago. Across Surrey the same figure rose by a fifth.
The number of young people in Epsom and Ewell claiming out-of-work benefits has not risen in a year. In every other Surrey district it has.
There were 185 people aged 16 to 24 on the claimant count in the borough in September 2026, against 190 in September 2025. Across Surrey the same age group rose from 2,860 to 3,425, an increase of 19.8 per cent. The figures come from the ONS claimant count, published through Nomis.
Every count is rounded to the nearest five. So the honest reading of 190 to 185 is “flat”, not “falling”. But flat is still unusual: the other ten Surrey districts rose by between 8.5 and 32.1 per cent.
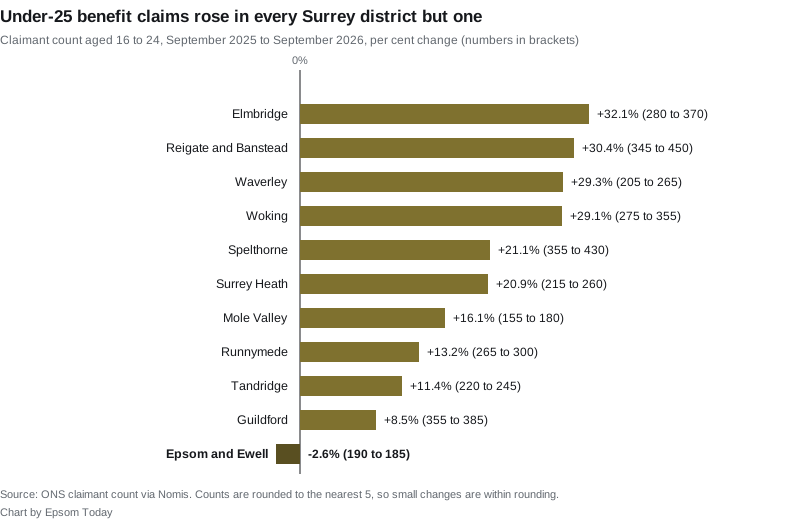
This is the second release running to show the same thing. In July’s figures, Epsom and Ewell was also the only Surrey district where under-25 claims fell.
The whole borough: up 4.3 per cent in a year
Across all ages, 1,095 people in Epsom and Ewell were on the claimant count in September. That is 2.1 per cent of residents aged 16 to 64.
- A year earlier, in September 2025, it was 1,050. That is a rise of 45, or 4.3 per cent.
- A month earlier, in August 2026, it was 1,060. That is a rise of 35.
- Across Surrey the count rose 7.4 per cent in the year, from 17,240 to 18,515.
Only Tandridge had a smaller rise over the year, at 1.9 per cent. Elmbridge, Woking, Reigate and Banstead and Runnymede all rose by around 9 per cent or more.
Epsom and Ewell’s rate of 2.1 per cent is the fourth lowest of Surrey’s eleven districts. Mole Valley is lowest at 1.9 per cent. Spelthorne is highest at 3.6 per cent.
Where the rise is now
In July the borough’s increase sat almost entirely with the over-50s. In September it is spread differently.
| Age | Epsom and Ewell 2025 | Epsom and Ewell 2026 | Change | Surrey change |
|---|---|---|---|---|
| 16 to 24 | 190 | 185 | -2.6% | +19.8% |
| 25 to 49 | 605 | 645 | +6.6% | +2.0% |
| 50 and over | 255 | 265 | +3.9% | +11.7% |
| All ages | 1,050 | 1,095 | +4.3% | +7.4% |
The 25 to 49 group now carries most of the borough’s increase, 40 of the 45 extra claimants. That runs against the county, where that age group barely moved and the biggest rises were among the young and the over-50s.
How to read these figures
- The claimant count records people claiming benefits principally for being out of work. Under Universal Credit that includes some people in low-paid work who still have to look for more.
- It is not seasonally adjusted, so we compare September with September.
- Every figure is rounded to the nearest five. In a borough this size, treat small changes as a direction, not a precise count.
- The figures cover Epsom and Ewell borough only. Ashtead and Leatherhead are in Mole Valley; Banstead and Tadworth are in Reigate and Banstead.
What it means for you
- If you are 16 to 24 and looking for work here, the local picture is still better than the county one. The young people’s count has held level while it climbed by a fifth across Surrey.
- If you are 25 to 49, this is the group where claims in the borough have risen fastest over the past year, against the county trend.
- For the over-50s, the sharp rise we reported in July has slowed to 3.9 per cent over the year, well below Surrey’s 11.7 per cent.
What a home costs in the borough is on Epsom house prices, and how the council tax bands work is on Epsom council tax bands.
Sources
- ONS claimant count, dataset NM_162_1, via Nomis, for every figure in this article: Epsom and Ewell (E07000208), Surrey (E10000030) and Surrey’s eleven districts, by age, September 2025, August 2026 and September 2026, not seasonally adjusted.
Revision, 17 November 2026: the ONS has revised the September 2026 figures. The borough total is now 1,090, not 1,095, and the 25 to 49 count is 640, not 645, so that age group accounts for 35 of the 40 extra claimants over the year. The under-25 and over-50 figures are unchanged. October’s figures are in our latest report.
Have your say