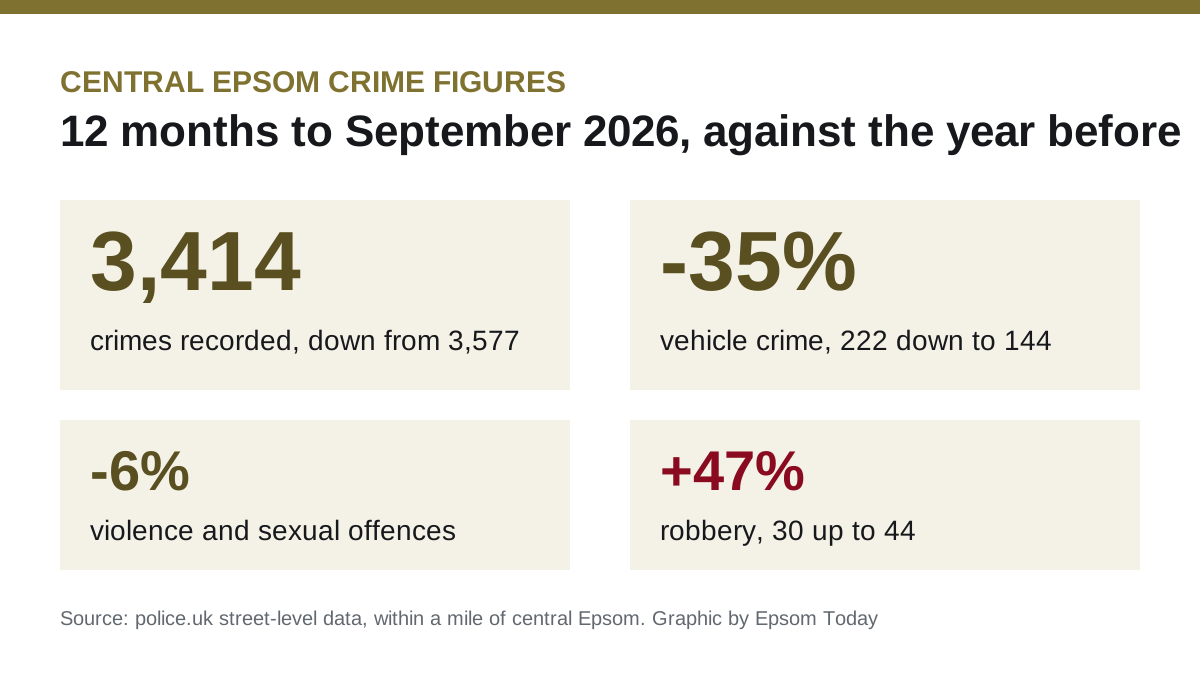

Police recorded 3,414 crimes within a mile of central Epsom in the year to September, down from 3,577. Vehicle crime fell by a third and robbery rose.
Police recorded 3,414 crimes within a mile of central Epsom in the 12 months to September 2026. That is 163 fewer than the year before, a fall of 5%.
The clearest change is in vehicle crime. It fell from 222 to 144, down by more than a third. Robbery went the other way, from 30 to 44, though the numbers are small.
The figures are the Home Office’s street-level crime data for Surrey Police, published on police.uk. September 2026 is the latest month available. We compared October 2025 to September 2026 with October 2024 to September 2025. The area is the police.uk one-mile radius around central Epsom, the same area we used for our burglary figures in September.
What rose and what fell
Violence and sexual offences remain the largest category, at 1,117 reports, or about one crime in three. That is down 6% on the year before.
| Crime type | Oct 2024 to Sep 2025 | Oct 2025 to Sep 2026 | Change |
|---|---|---|---|
| Violence and sexual offences | 1,185 | 1,117 | -6% |
| Anti-social behaviour | 560 | 565 | +1% |
| Shoplifting | 339 | 343 | +1% |
| Public order | 299 | 327 | +9% |
| Criminal damage and arson | 253 | 267 | +6% |
| Other theft | 222 | 181 | -18% |
| Vehicle crime | 222 | 144 | -35% |
| Drugs | 132 | 137 | +4% |
| Burglary | 120 | 121 | +1% |
| Other crime | 86 | 56 | -35% |
| Bicycle theft | 53 | 44 | -17% |
| Robbery | 30 | 44 | +47% |
| Theft from the person | 46 | 38 | -17% |
| Possession of weapons | 30 | 30 | 0% |
| All crime | 3,577 | 3,414 | -5% |
Three points stand out:
- Vehicle crime fell the most. Police.uk counts thefts of and from vehicles and vehicle interference in this category.
- Robbery rose by 14 cases. On counts this small, a handful of incidents moves the percentage a long way.
- Burglary has levelled off. It was 121 in the latest year against 120 the year before. In the year to July, burglary was up 35% after a run of break-ins from August 2025 to January 2026. That spike has now dropped out of the comparison.
Month by month
September 2026 had 281 recorded crimes. September 2025 had 374, the highest month in the two years we looked at. So a single-month comparison makes the fall look bigger than it is. The 12-month total is the fairer measure.
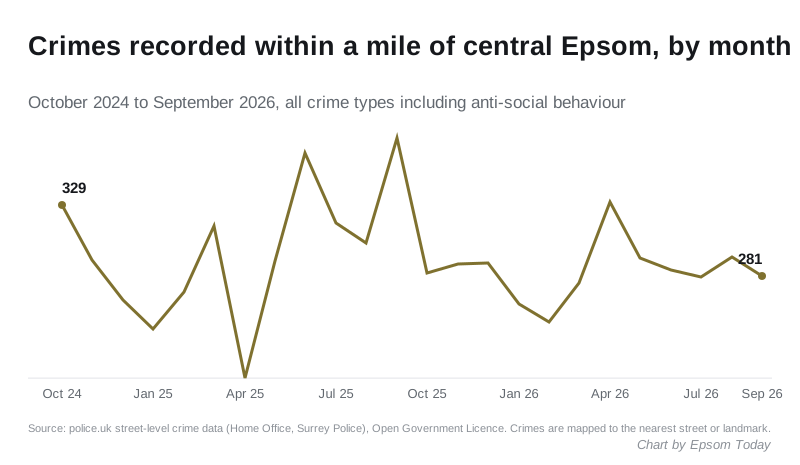
In the latest month, violence and sexual offences accounted for 87 of the 281 reports. Anti-social behaviour was next, at 54, followed by shoplifting at 25. (police.uk street-level data, September 2026)
What the figures can and cannot tell you
Police.uk places each crime at the nearest mapped street or landmark, not the exact address. Forces also revise their figures for several months after publication, so these totals can change slightly.
The figures count crimes that were reported and recorded. A change can reflect police activity or reporting habits as well as crime itself. Drug and weapons offences, for example, are mostly recorded when officers stop and search someone.
What it means for you
- To report a crime that is not an emergency, call 101 or report it on the Surrey Police website. In an emergency, call 999.
- To see crime on your own street, enter your postcode on police.uk. The map shows the same data month by month.
- For anti-social behaviour, the council has signed the ASB Help pledge, which sets out how it supports victims.
- If you park in town, our parking in Epsom guide lists the council car parks.
Sources
- Home Office street-level crime data for Surrey Police, October 2024 to September 2026, via the police.uk API, Open Government Licence. Counts are for the one-mile radius around central Epsom (51.3353, -0.2624).
Have your say